

Graphically find the cross-correlation c Æh (x) of the two functions shown here: Figure P.11.41 How wide
Question:
Figure P.11.41
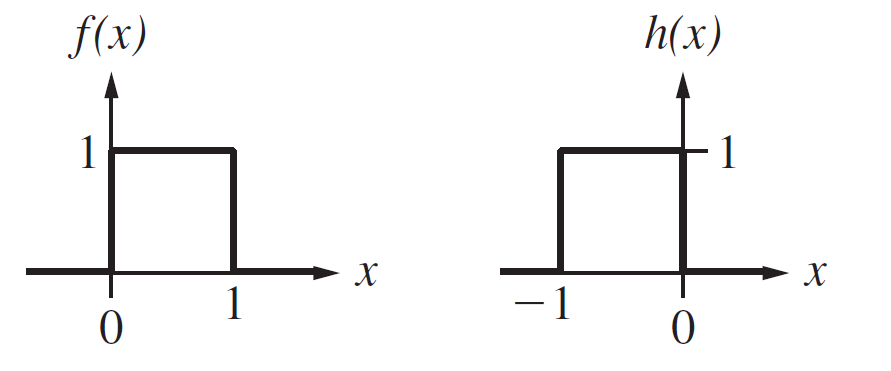
How wide will it be? At what value of x will the correlation peak? What is the maximum value of cÆ’h(x)? Is it symmetrical? Slide either one over the other.
Fantastic news! We've Found the answer you've been seeking!
Step by Step Answer:
The width of gX is the sum of th...View the full answer

Answered By
Marcus Solomon
I am committed to ensuring that my services always meet the clients' expectations.
82+ Reviews
117+ Question Solved
Related Book For 
Question Posted:
