

Based on the energy diagrams in Figure 15. 2, sketch a graph showing velocity as a function
Question:
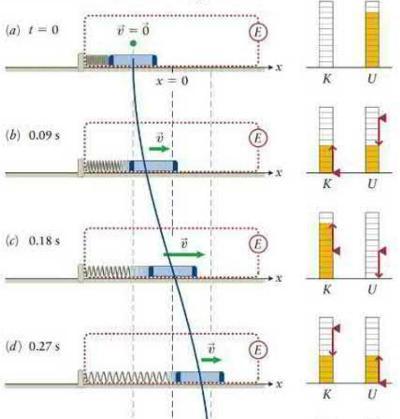
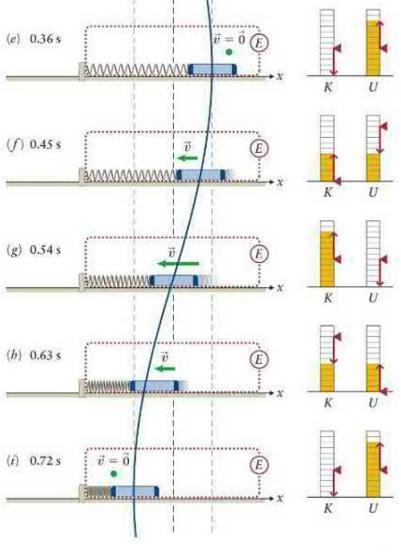
Based on the energy diagrams in Figure 15. 2, sketch a graph showing velocity as a function of position for the cart represented in the figure.
Data from Figure 15. 2
Step by Step Answer:

This question has not been answered yet.
You can Ask your question!
Related Book For 

Question Posted:
