

Figure 15. 12 illustrates the (x) component of the vector sum of forces on an object for
Question:
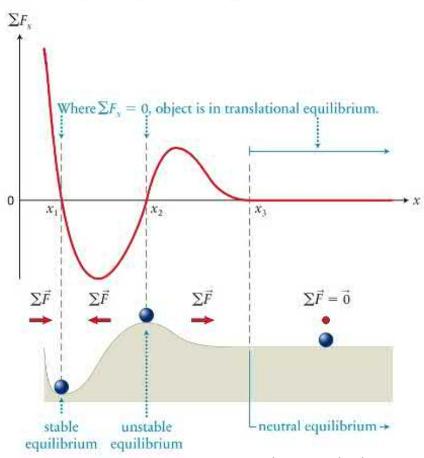
Figure 15. 12 illustrates the \(x\) component of the vector sum of forces on an object for conditions of stable, unstable, and neutral equilibrium.
(a) Examine this graph carefully. What visible feature differs in the three types of equilibrium?
(b) Express your result as a set of mathematical relationships that can be used to discriminate stable from unstable or neutral equilibrium.
(c) Are these relationships general? That is, can you construct a graph showing the \(x\) component of the vector sum of forces versus position that meets the requirements for stable equilibrium but violates your mathematical expression?
Data from Figure 15.12
Step by Step Answer:

This question has not been answered yet.
You can Ask your question!
Related Book For 
Question Posted:
