

Figure 20. 26 shows the energy changes for a certain system over a short time interval. Describe
Question:
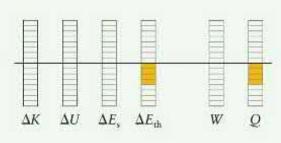
Figure 20. 26 shows the energy changes for a certain system over a short time interval. Describe what is happening to the system. From the diagram, what can you conclude about the temperature of the environment at the beginning of the time interval?
Data from Figure 20. 26
Fantastic news! We've Found the answer you've been seeking!
Step by Step Answer:
The thermal energy of the system is decreasing leftDelt...View the full answer

Answered By
Utsab mitra
I have the expertise to deliver these subjects to college and higher-level students. The services would involve only solving assignments, homework help, and others.
I have experience in delivering these subjects for the last 6 years on a freelancing basis in different companies around the globe. I am CMA certified and CGMA UK. I have professional experience of 18 years in the industry involved in the manufacturing company and IT implementation experience of over 12 years.
I have delivered this help to students effortlessly, which is essential to give the students a good grade in their studies.
2+ Reviews
10+ Question Solved
Related Book For 
Question Posted:
