

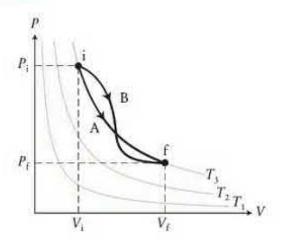
Figure P20.27 shows two processes, A and B, carried out on an ideal gas. In which process
Question:
Figure P20.27 shows two processes, A and B, carried out on an ideal gas. In which process was the amount of work done by the gas greater?
Data from Figure P20.27
Fantastic news! We've Found the answer you've been seeking!
Step by Step Answer:

Answered By
Charles mwangi
I am a postgraduate in chemistry (Industrial chemistry with management),with writing experience for more than 3 years.I have specialized in content development,questions,term papers and assignments.Majoring in chemistry,information science,management,human resource management,accounting,business law,marketing,psychology,excl expert ,education and engineering.I have tutored in other different platforms where my DNA includes three key aspects i.e,quality papers,timely and free from any academic malpractices.I frequently engage clients in each and every step to ensure quality service delivery.This is to ensure sustainability of the tutoring aspects as well as the credibility of the platform.
2+ Reviews
10+ Question Solved
Related Book For 
Question Posted:
