

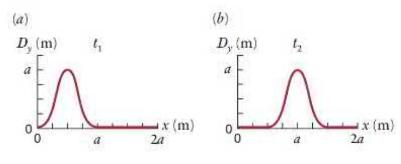
The graphs in Figure P16.4 show the displacement caused by a wave moving along a string at
Question:
The graphs in Figure P16.4 show the displacement caused by a wave moving along a string at two instants,
(a) \(t_{1}\) and
(b) \(t_{2}\). Let \(v_{\mathrm{av}}\) denote the average speed of a piece of string during the time interval between \(t_{1}\) and \(t_{2}\). Compare the wave speed \(c\) to \(v_{\mathrm{av}}\) of a piece of the string at the position \(x=a\).
Data from P16.4
Fantastic news! We've Found the answer you've been seeking!
Step by Step Answer:

Answered By
JAPHETH KOGEI
Hi there. I'm here to assist you to score the highest marks on your assignments and homework. My areas of specialisation are:
Auditing, Financial Accounting, Macroeconomics, Monetary-economics, Business-administration, Advanced-accounting, Corporate Finance, Professional-accounting-ethics, Corporate governance, Financial-risk-analysis, Financial-budgeting, Corporate-social-responsibility, Statistics, Business management, logic, Critical thinking,
So, I look forward to helping you solve your academic problem.
I enjoy teaching and tutoring university and high school students. During my free time, I also read books on motivation, leadership, comedy, emotional intelligence, critical thinking, nature, human nature, innovation, persuasion, performance, negotiations, goals, power, time management, wealth, debates, sales, and finance. Additionally, I am a panellist on an FM radio program on Sunday mornings where we discuss current affairs.
I travel three times a year either to the USA, Europe and around Africa.
As a university student in the USA, I enjoyed interacting with people from different cultures and ethnic groups. Together with friends, we travelled widely in the USA and in Europe (UK, France, Denmark, Germany, Turkey, etc).
So, I look forward to tutoring you. I believe that it will be exciting to meet them.
2+ Reviews
10+ Question Solved
Related Book For 

Question Posted:
