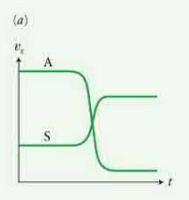
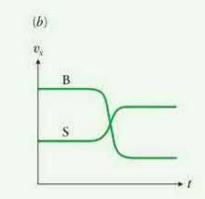
The graphs in Figures (4.17 a) and (4.17 b) show the effects of carts A and B
Question:
The graphs in Figures \(4.17 a\) and \(4.17 b\) show the effects of carts A and B colliding (separately) with a standard cart S. List the three carts in order of increasing inertia.
Data from Figure 4.17 a

Data from Figure 4.17 b

Transcribed Image Text:
(a) A S
Fantastic news! We've Found the answer you've been seeking!
Step by Step Answer:
Answer rating: 100% (QA)
A and B identical and less mathrmS greater Because the magnitud...View the full answer

Answered By

Ashington Waweru
I am a lecturer, research writer and also a qualified financial analyst and accountant. I am qualified and articulate in many disciplines including English, Accounting, Finance, Quantitative spreadsheet analysis, Economics, and Statistics. I am an expert with sixteen years of experience in online industry-related work. I have a master's in business administration and a bachelor’s degree in education, accounting, and economics options.
I am a writer and proofreading expert with sixteen years of experience in online writing, proofreading, and text editing. I have vast knowledge and experience in writing techniques and styles such as APA, ASA, MLA, Chicago, Turabian, IEEE, and many others.
I am also an online blogger and research writer with sixteen years of writing and proofreading articles and reports. I have written many scripts and articles for blogs, and I also specialize in search engine
I have sixteen years of experience in Excel data entry, Excel data analysis, R-studio quantitative analysis, SPSS quantitative analysis, research writing, and proofreading articles and reports. I will deliver the highest quality online and offline Excel, R, SPSS, and other spreadsheet solutions within your operational deadlines. I have also compiled many original Excel quantitative and text spreadsheets which solve client’s problems in my research writing career.
I have extensive enterprise resource planning accounting, financial modeling, financial reporting, and company analysis: customer relationship management, enterprise resource planning, financial accounting projects, and corporate finance.
I am articulate in psychology, engineering, nursing, counseling, project management, accounting, finance, quantitative spreadsheet analysis, statistical and economic analysis, among many other industry fields and academic disciplines. I work to solve problems and provide accurate and credible solutions and research reports in all industries in the global economy.
I have taught and conducted masters and Ph.D. thesis research for specialists in Quantitative finance, Financial Accounting, Actuarial science, Macroeconomics, Microeconomics, Risk Management, Managerial Economics, Engineering Economics, Financial economics, Taxation and many other disciplines including water engineering, psychology, e-commerce, mechanical engineering, leadership and many others.
I have developed many courses on online websites like Teachable and Thinkific. I also developed an accounting reporting automation software project for Utafiti sacco located at ILRI Uthiru Kenya when I was working there in year 2001.
I am a mature, self-motivated worker who delivers high-quality, on-time reports which solve client’s problems accurately.
I have written many academic and professional industry research papers and tutored many clients from college to university undergraduate, master's and Ph.D. students, and corporate professionals. I anticipate your hiring me.
I know I will deliver the highest quality work you will find anywhere to award me your project work. Please note that I am looking for a long-term work relationship with you. I look forward to you delivering the best service to you.
3.00+
2+ Reviews
10+ Question Solved
Related Book For 

Question Posted:
Students also viewed these Physics questions
-
The following additional information is available for the Dr. Ivan and Irene Incisor family from Chapters 1-5. Ivan's grandfather died and left a portfolio of municipal bonds. In 2012, they pay Ivan...
-
CANMNMM January of this year. (a) Each item will be held in a record. Describe all the data structures that must refer to these records to implement the required functionality. Describe all the...
-
Briefly describe ASCII and Unicode and draw attention to any relationship between them. [3 marks] (b) Briefly explain what a Reader is in the context of reading characters from data. [3 marks] A...
-
Given a sorted array of Comparable items, write functions floor () and ceiling () that return the index of the largest (or smallest) item not larger (or smaller) than an argument item in logarithmic...
-
The bookkeeper of Oliver Services Co., a proprietorship, prepared the balance sheet of the company while the accountant was ill. The balance sheet is not correct. The bookkeeper knew that the balance...
-
This chapter begins with an architecture checklist. If you had to rank the items, from most important to least important, what would your list look like? Explain your answer.
-
Let us consider a random linear constraint where a axb,
-
You were requested to personally deliver your auditors report to the board of directors of Sebal Manufacturing Corporation and answer questions posed about the financial statements. While reading the...
-
Amazon Inc. has semiannual coupon bonds with 5% coupon rate and 20 years remaining to maturity. The bonds are selling for 78% of par value. What is the (annual) yield of maturity of the bonds? Note...
-
The graphs in Figures \(4.17 c\) and \(4.17 d\) show the effects of carts A and B colliding (separately) with a standard cart \(\mathrm{S}\). Which has greater inertia, \(\mathrm{A}\) or...
-
Two carts give the same velocity-versus-time graphs when they collide with the same standard cart. Can you conclude from this information that the two carts are identical?
-
The records of Armstrong Aviation Supply Inc. include the following accounts for inventory of aviation fuel at December 31, 2014: Requirements 1. Prepare a partial income statement through gross...
-
You work as a salesperson for a 3D printing company that designs and manufactures 3D solutions for engineering, pharmaceuticals, national museums, film production companies, and many others. Your...
-
Starburst is a company focused on solving the pains of data access. It provides a modern solution that addresses data silo and speed of access problems. Starburst product allows customers to analyze...
-
One of the more interesting developments in sales force management is the use of customer feedback to improve the performance of salespeople. These programs go by a variety of names such as...
-
Upsilon Natural Gas, Inc. is a monopoly enjoying very high barriers to entry. Its marginal cost is \(\$ 40\) and its average cost is \(\$ 70\). A recent market study has determined that the price...
-
A Mexican firm employs unskilled, semiskilled, and skilled labor in a cost-minimizing mix at its manufacturing plant. The marginal product of unskilled labor is considerably lower than semiskilled...
-
Write a computer program that lists the states P, T, and v along the process curve in Problem 3.111
-
Doorharmony Company makes doorbells. It has a weighted- average cost of capital of 5% and total assets of $ 5,900,000. Doorharmony has current liabilities of $ 750,000. Its operating income for the...
-
1. 500 people responded to a newspaper survey. The purpose of the survey was to figure out how many people liked the cartoon Tom & Jerry vs. The road runner. 275 people liked the road runner and 172...
-
Given the languages, L as follows in Table 1. For each language answer questions (a)-(c): a) Design the Turing Machine that accept the language L(M). b) What is the shortest string in the language...
-
CP3-3 (Static) Comparing Companies within an Industry LO3-2, 3-4, 3-6 Refer to the following: Target Corporation in Appendix B, Walmart in Appendix C, and the Industry Ratio Report in Appendix D at...

Study smarter with the SolutionInn App


