

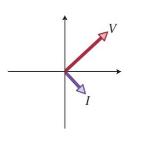
The phasor diagram in Figure P32.14 shows the potential difference across a circuit element and the current
Question:
The phasor diagram in Figure P32.14 shows the potential difference across a circuit element and the current through the element at \(t=0\).
(a) Is the element a resistor, capacitor, or inductor?
(b) On a single graph, sketch a curve showing \(v\) as a function of time and a curve showing \(i\) as a function of time.
Data from Figure P32.14
Step by Step Answer:

This question has not been answered yet.
You can Ask your question!
Related Book For 

Question Posted:
