

The diagram shows a sketch of part of the graph y = h(x), where h(x) = a
Question:
The diagram shows a sketch of part of the graph y = h(x), where h(x) = a − 2|x + 3|, x ∈ ℝ. The graph intercepts the y-axis at (0, 4).
a. Find the value of a.
b. Find the coordinates of P and Q.
c. Solve h(x) = 1/3 x + 6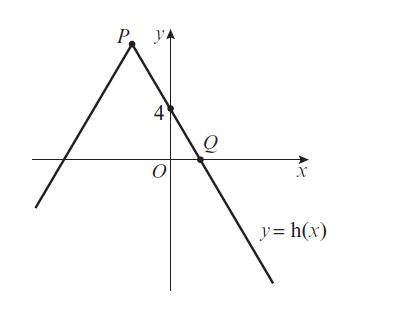
Fantastic news! We've Found the answer you've been seeking!
Step by Step Answer:
a To find the value of a we can use the fact that the graph intercepts the yaxis at 0 4 This means t...View the full answer

Answered By
Faith Chebet
In the past two years many of my students have excell with the knowledge I taught them.
0 Reviews
10+ Question Solved
Related Book For 

Pearson Edexcel A Level Mathematics Pure Mathematics Year 2
ISBN: 9781292183404
1st Edition
Authors: Greg Attwood, Jack Barraclough, Ian Bettison, David Goldberg, Alistair Macpherson, Joe Petran
Question Posted:
