

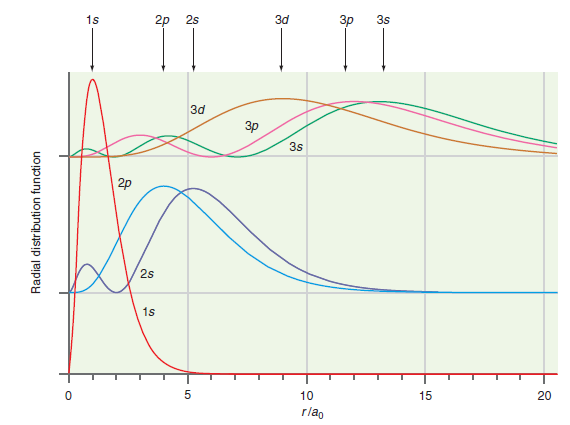
How do the results shown in Figure 20.10 differ from the predictions of the Bohr model of
Question:
Figure 20.10
Fantastic news! We've Found the answer you've been seeking!
Step by Step Answer:
The Bohr model predicts that the electron ...View the full answer

Answered By
Sultan Ghulam Dastgir
The following are details of my Areas of Effectiveness English Language Proficiency, Organization Behavior , consumer Behavior and Marketing, Communication, Applied Statistics, Research Methods , Cognitive & Affective Processes, Cognitive & Affective Processes, Data Analysis in Research, Human Resources Management ,Research Project,
Social Psychology, Personality Psychology, Introduction to Applied Areas of Psychology,
Behavioral Neurosdence , Historical and Contemporary Issues in Psychology, Measurement in Psychology, experimental Psychology,
1+ Reviews
10+ Question Solved
Related Book For 

Question Posted:
