When vibrational transitions are observed in an electronic absorption spectrum, these transitions can be used to determine
Question:
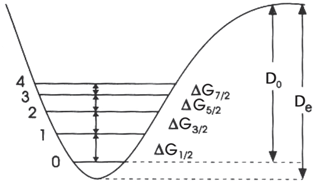
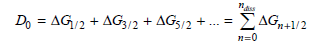
The central idea behind the approach is that the dissociation energy is equal to the sum of these energy differences from n = 0 to the dissociation limit:
a. For the ground state of I2 the following values for ΔG versus n were determined (J. Chem. Phys. 32 (1960): 738.
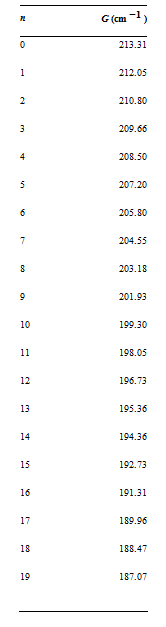
If the potential function can be described by a Morse potential [Equation (19.5)], ΔG will be a linear function of n + 1/2. Construct a Birge€“Sponer plot (ΔG versus n + 1/2) using the given data, and, using the best fit to a straight line, to determine the value of n where ΔG = 0. This is the I2 ground-state vibrational quantum number at dissociation.
b. The area under the Birge€“Sponer plot is equal to the dissociation energy, D0. This area can be determined by summing the ΔG values from n = 0 to n at dissociation [determined in part (a)]. Perform this summation to determine D0 for ground state I2. You can also integrate the best fit equation to determine D0.
Step by Step Answer:
a The plot of G versus n 12 with best fit to a straight line is given below Using the expression ...View the full answer