

The velocity of a car increases with time as shown in the graph. a. What is the
Question:
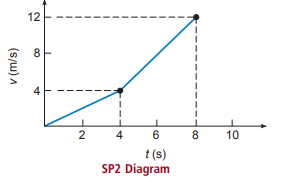
The velocity of a car increases with time as shown in the graph.
a. What is the average acceleration between 0 seconds and 4 seconds?
b. What is the average acceleration between 0 seconds and 8 seconds?
c. Is the result in part c equal to the average of the two values in parts a and b? Compare and explain.
Fantastic news! We've Found the answer you've been seeking!
Step by Step Answer:
Average acceleration is the change in velocity divide by the time required to produce that change Th...View the full answer

Answered By
Joseph Njoroge
I am a professional tutor with more than six years of experience. I have helped thousands of students to achieve their academic goals. My primary objectives as a tutor is to ensure that students do not have problems while tackling their academic problems.
10+ Reviews
27+ Question Solved
Related Book For 
Physics of Everyday Phenomena A conceptual Introduction to physics
ISBN: 978-0073512112
6th edition
Authors: W. Thomas Griffith, Juliet W. Brosing
Question Posted:
