

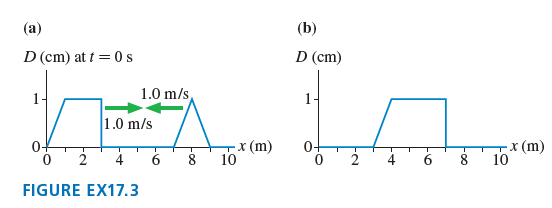
FIGURE EX17.3a is a snapshot graph at t = 0 s of two waves approaching each other
Question:
Fantastic news! We've Found the answer you've been seeking!
Step by Step Answer:
Model The principle of superposition comes into play ...View the full answer

Answered By
Branice Buyengo Ajevi
I have been teaching for the last 5 years which has strengthened my interaction with students of different level.
1+ Reviews
10+ Question Solved
Related Book For 

Physics for Scientists and Engineers A Strategic Approach with Modern Physics
ISBN: 978-0133942651
4th edition
Authors: Randall D. Knight
Question Posted:
