

FIGURE EX20.10 is a histogram showing the speeds of the molecules in a very small gas. What
Question:
FIGURE EX20.10 is a histogram showing the speeds of the molecules in a very small gas. What are
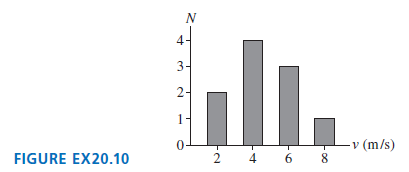
(a) The most probable speed,
(b) The average speed,
(c) The rms speed?
Fantastic news! We've Found the answer you've been seeking!
Step by Step Answer:
Solve a The most probable s...View the full answer

Answered By
Ajeet Singh
Hi there! Are you looking for a committed, reliable, and enthusiastic tutor? Well, teaching and learning are more of a second nature to me, having been raised by parents who are both teachers. I have done plenty of studying and lots of learning on many exciting and challenging topics. All these experiences have influenced my decision to take on the teaching role in various capacities. As a tutor, I am looking forward to getting to understand your needs and helping you achieve your academic goals. I'm highly flexible and contactable. I am available to work on short notice since I only prefer to work with very small and select groups of students. Areas of interest: Business, accounting, Project management, sociology, technology, computers, English, linguistics, media, philosophy, political science, statistics, data science, Excel, psychology, art, history, health education, gender studies, cultural studies, ethics, religion. I am also decent with math(s) & Programming. If you have a project you think I can take on, please feel welcome to invite me, and I'm going to check it out!
4+ Reviews
24+ Question Solved
Related Book For 

Physics for Scientists and Engineers A Strategic Approach with Modern Physics
ISBN: 978-0133942651
4th edition
Authors: Randall D. Knight
Question Posted:
