

FIGURE EX2.4 is the position-versus-time graph of a jogger. What is the joggers velocity at t =
Question:
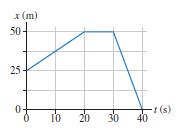
FIGURE EX2.4 is the position-versus-time graph of a jogger. What is the jogger’s velocity at t = 10 s, at t = 25 s, and at t = 35 s?
FIGURE EX2.4:
Fantastic news! We've Found the answer you've been seeking!
Step by Step Answer:

Answered By
S Mwaura
A quality-driven writer with special technical skills and vast experience in various disciplines. A plagiarism-free paper and impeccable quality content are what I deliver. Timely delivery and originality are guaranteed. Kindly allow me to do any work for you and I guarantee you an A-worthy paper.
27+ Reviews
73+ Question Solved
Related Book For 

Physics for Scientists and Engineers A Strategic Approach with Modern Physics
ISBN: 978-0133942651
4th edition
Authors: Randall D. Knight
Question Posted:
