

Figure EX26.9 shows a graph of V versus x in a region of space. The potential is
Question:
Figure EX26.9 shows a graph of V versus x in a region of space. The potential is independent of y and z. What is Exat
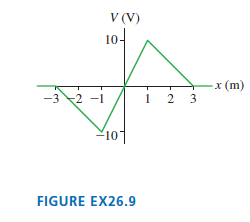
(a) X = -2 cm,
(b) X = 0 cm,
(c) X = 2 cm?
Fantastic news! We've Found the answer you've been seeking!
Step by Step Answer:
Model The electric field is the negative of the slope of the graph of the ...View the full answer

Answered By
ALBANUS MUTUKU
If you are looking for exceptional academic and non-academic work feel free to consider my expertise and you will not regret. I have enough experience working in the freelancing industry hence the unmistakable quality service delivery
178+ Reviews
335+ Question Solved
Related Book For 

Physics for Scientists and Engineers A Strategic Approach with Modern Physics
ISBN: 978-0133942651
4th edition
Authors: Randall D. Knight
Question Posted:
