

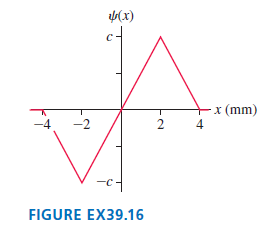
FIGURE EX39.16 shows the wave function of a neutron. a. What is the value of c? b.
Question:
a. What is the value of c?
b. Draw a graph of |ψ(x)|2.
c. What is the probability that the neutron is located between x = -1.0 mm and x = 1.0 mm?
Fantastic news! We've Found the answer you've been seeking!
Step by Step Answer:
Model The probability of finding the particle is determined by the probability density Px x 2 ...View the full answer

Answered By
Arshad Ahmad
Well, I am really new to tutoring but I truly believe a good student can be a better teacher. I have always been a topper at school. I passed my Chartered Accountancy at a very young age of 23, a rare feat for most of the students. I am really dedicated to whatever work I do and I am very strict regarding deadlines. i am always committed and dedicated to whatever work allotted to me and I make sure it is completed well within deadline and also I try to give my best in whatever I do. Hope we will have a good time studying together.
1+ Reviews
10+ Question Solved
Related Book For 

Physics for Scientists and Engineers A Strategic Approach with Modern Physics
ISBN: 978-0133942651
4th edition
Authors: Randall D. Knight
Question Posted:
