

Figure Q16.3 is a history graph showing the displacement as a function of time at one point
Question:
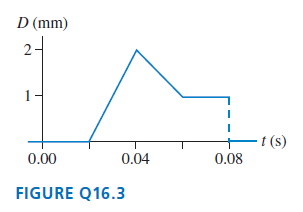
Figure Q16.3 is a history graph showing the displacement as a function of time at one point on a string. Did the displacement at this point reach its maximum of 2 mm before or after the interval of time when the displacement was a constant 1 mm?
Fantastic news! We've Found the answer you've been seeking!
Step by Step Answer:
The constant 1 mm displaceme...View the full answer

Answered By
PALASH JHANWAR
I am a Chartered Accountant with AIR 45 in CA - IPCC. I am a Merit Holder ( B.Com ). The following is my educational details.
PLEASE ACCESS MY RESUME FROM THE FOLLOWING LINK: https://drive.google.com/file/d/1hYR1uch-ff6MRC_cDB07K6VqY9kQ3SFL/view?usp=sharing
3+ Reviews
10+ Question Solved
Related Book For 

Physics for Scientists and Engineers A Strategic Approach with Modern Physics
ISBN: 978-0133942651
4th edition
Authors: Randall D. Knight
Question Posted:
