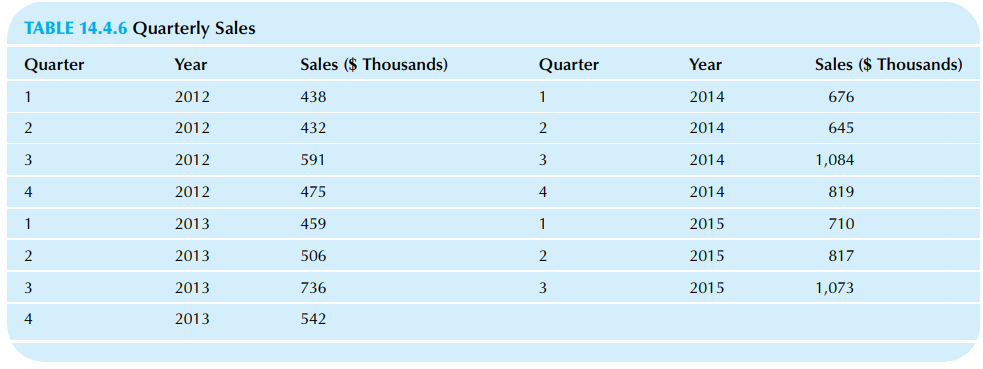
Consider the time series of quarterly sales in thousands shown in Table 14.4.6. The seasonal indices are
Question:
Consider the time series of quarterly sales in thousands shown in Table 14.4.6. The seasonal indices are 0.89 for quarter 1, 0.88 for 2, 1.27 for 3, and 0.93 for 4.
a. Find the seasonally adjusted sales corresponding to each sales value.
b. In which quarter is the most business generally done?
c. As indicated in the data, sales increased from 817 to 1,073 in 2015 from quarters 2 to 3. What happened during this period on a seasonally adjusted basis?
d. As indicated in the data, sales decreased from 1,084 to 819 in 2014 from quarters 3 to 4. What happened during this period on a seasonally adjusted basis?
e. The exponential trend values for the four quarters of 2019 are 1,964, 2,070, 2,183, and 2,301. Seasonalize these trend forecasts to obtain actual sales forecasts for 2019.
Step by Step Answer:
a The seasonally adjusted sales values in thousands are 4921 4909 4654 5108 5157 5750 5795 ...View the full answer