

Expose marine bacteria to X-rays for time periods from 1 to 15 minutes. Here is a scatterplot
Question:
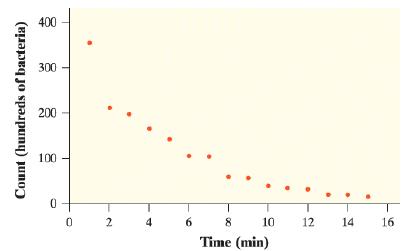
Expose marine bacteria to X-rays for time periods from 1 to 15 minutes. Here is a scatterplot showing the number of surviving bacteria (in hundreds) on a culture plate after each exposure time:
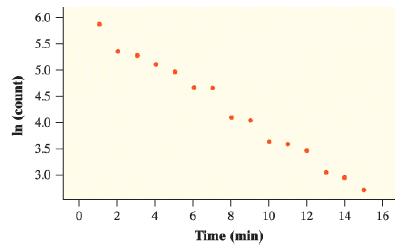
a. Below is a scatterplot of the natural logarithm of the number of surviving bacteria versus time. Based on this graph, explain why it would be reasonable to use an exponential model to describe the relationship between count of bacteria and time.
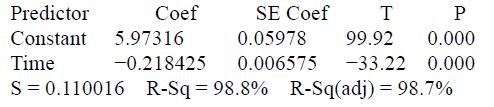
b. Here is output from a linear regression analysis of the transformed data. Give the equation of the least-squares regression line. Be sure to define any variables you use.
c. Use your model to predict the number of surviving bacteria after 17 minutes.
Fantastic news! We've Found the answer you've been seeking!
Step by Step Answer:
a Roughly ...View the full answer

Answered By
Nyron Beeput
I am an active educator and professional tutor with substantial experience in Biology and General Science. The past two years I have been tutoring online intensively with high school and college students. I have been teaching for four years and this experience has helped me to hone skills such as patience, dedication and flexibility. I work at the pace of my students and ensure that they understand.
My method of using real life examples that my students can relate to has helped them grasp concepts more readily. I also help students learn how to apply their knowledge and they appreciate that very much.
1+ Reviews
10+ Question Solved
Related Book For 

Question Posted:
