

Refer to Exercise 34. Here is a graph of 1Pressure versus volume, along with output from a
Question:
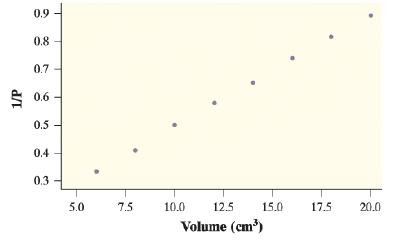
Refer to Exercise 34. Here is a graph of 1Pressure versus volume, along with output from a linear regression analysis using these variables:
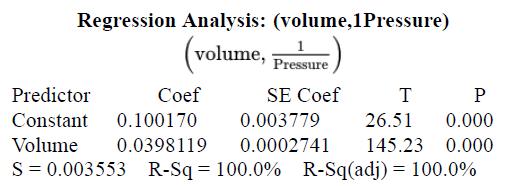
a. Give the equation of the least-squares regression line. Define any variables you use.
b. Use the model from part (a) to predict the pressure in the syringe when the volume is 17 cubic centimeters.
Exercise 34.
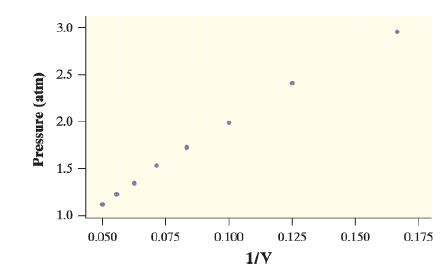
If you have taken a chemistry or physics class, then you are probably familiar with Boyle’s law: for gas in a confined space kept at a constant temperature, pressure times volume is a constant (in symbols, PV = k). Students in a chemistry class collected data on pressure and volume using a syringe and a pressure probe. If the true relationship between the pressure and volume of the gas is PV=k, then
P = k 1/v
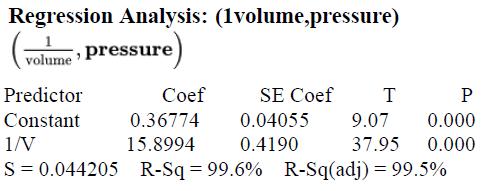
Here is a graph of pressure versus 1/volume, along with output from a linear regression analysis using these variables:
Step by Step Answer:
a To find the equation of the leastsquares regression line we need to calculate the ...View the full answer


