

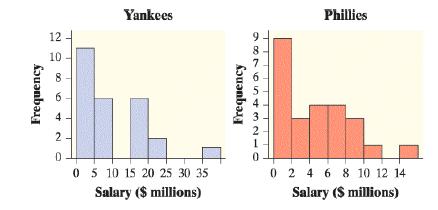
Refer to Exercise 73. Here is a better graph of the 2008 salary distributions for the Yankees
Question:
Refer to Exercise 73. Here is a better graph of the 2008 salary distributions for the Yankees and the Phillies. Write a few sentences comparing these two distributions.
Exercise 73.
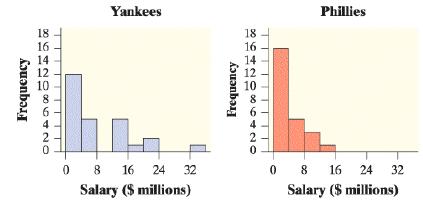
Does paying high salaries lead to more victories in professional sports? The New York Yankees have long been known for having Major League Baseball’s highest team payroll. And over the years, the team has won many championships. This strategy didn’t pay off in 2008, when the Philadelphia Phillies won the World Series. Maybe the Yankees didn’t spend enough money that year. The figure shows histograms of the salary distributions for the two teams during the 2008 season. Why can’t you use these graphs to effectively compare the team payrolls?
Fantastic news! We've Found the answer you've been seeking!
Step by Step Answer:
a Both are payroll for different teams Phillies payroll has been falli...View the full answer

Answered By
Solomon Tetteh
I have been working as a part time teaching assistant at my university after my graduation for the past 2 years
0 Reviews
10+ Question Solved
Related Book For 

Question Posted:
