

The cumulative relative frequency graph describes the distribution of median household incomes in the 50 states in
Question:
The cumulative relative frequency graph describes the distribution of median household incomes in the 50 states in a recent year.
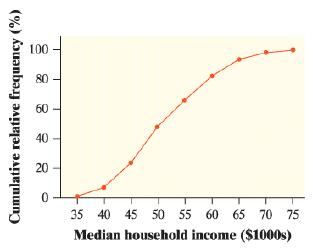
a. The median household income in North Dakota that year was $55,766. Is North Dakota an unusually wealthy state?
b. Estimate and interpret the 90th percentile of the distribution.
Fantastic news! We've Found the answer you've been seeking!
Step by Step Answer:
Given n 50 mean 5174244 and standard deviation 8210642 Now By the CUMULATIVE ...View the full answer

Related Book For 

Question Posted:
