

The dotplot shows the EPA highway gas mileage estimates in miles per gallon (mpg) for a random
Question:
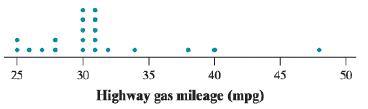
The dotplot shows the EPA highway gas mileage estimates in miles per gallon (mpg) for a random sample of 21 model year 2018 midsize cars. Explain why this distribution of highway gas mileage is not approximately Normal.
Fantastic news! We've Found the answer you've been seeking!
Step by Step Answer:
There is one point near 48 which is outlier and along with ...View the full answer

Answered By
Parveen Sharma
With over 8 years of hands- on, successful teaching and subject matter expert experience, I am confident in my ability and passion to become a positive addition to your school community as a Mathematics Teacher.
As you will see in the enclosed resume, I have earned Bachelor’s Degree in Mathematics, Bachelor’s degree in Education, as well many certifications in online tools to create world class teaching and learning material for all grade’s learners.
I have experience teaching Cycle 2 and 3 students in a variety of settings. I am currently teaching cycle 2 children at ministry of education school. As a former online math’s expert with Third Space Learning UK, I also have experience teaching KS1 and KS2 UK Govt school kids.
I encourage learning by using a number of different manipulatives, hands – on activities, and various forms of technology. By incorporating class discussions, open – ended questions and cooperative learning I am able to facilitate a highly interactive and inquisitive class atmosphere. In addition, I utilize weekly quizzes and monthly tests to track student progress, locate areas of weakness, and prepare students for final exams.
Being a hardworking and well – rounded educator, I welcome the opportunity to meet with you to discuss how my extensive experience, collaborative nature, and innovative classroom skills would benefit your mathematics program. Thank you for your time and consideration, and I look forward to hearing from you soon.
0 Reviews
10+ Question Solved
Related Book For 

Question Posted:
