

The figure shows the result of taking 25 SRSs from a Normal population and constructing a confidence
Question:
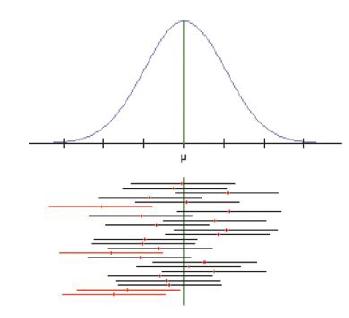
The figure shows the result of taking 25 SRSs from a Normal population and constructing a confidence interval for the population mean using each sample. Which confidence level —80%, 90%, 95%, or 99%—do you think was used? Explain your reasoning.
Fantastic news! We've Found the answer you've been seeking!
Step by Step Answer:
From the given diagram for part a the data is lies between 2 standa...View the full answer

Answered By
Marvine Ekina
Marvine Ekina
Dedicated and experienced Academic Tutor with a proven track record for helping students to improve their academic performance. Adept at evaluating students and creating learning plans based on their strengths and weaknesses. Bringing forth a devotion to education and helping others to achieve their academic and life goals.
PERSONAL INFORMATION
Address: , ,
Nationality:
Driving License:
Hobbies: reading
SKILLS
????? Problem Solving Skills
????? Predictive Modeling
????? Customer Service Skills
????? Creative Problem Solving Skills
????? Strong Analytical Skills
????? Project Management Skills
????? Multitasking Skills
????? Leadership Skills
????? Curriculum Development
????? Excellent Communication Skills
????? SAT Prep
????? Knowledge of Educational Philosophies
????? Informal and Formal Assessments
0 Reviews
10+ Question Solved
Related Book For 

Question Posted:
