

The following figure is a Normal probability plot of the emissions of carbon dioxide (CO 2 )
Question:
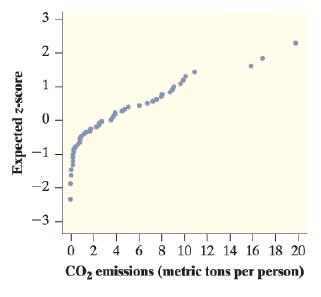
The following figure is a Normal probability plot of the emissions of carbon dioxide (CO2) per person in 48 countries.15 Use the graph to determine if this distribution of CO2 emissions is approximately Normal.
Fantastic news! We've Found the answer you've been seeking!
Step by Step Answer:
The distribution of CO 2 emissions is approximately not normally distribut...View the full answer

Answered By
Mark Macharia
I am a professional tutor offering academic assistance to students. With a Bachelors Degree in Financial Engineering I majored in complex but common subjects. My majors include:
-Mathematics
-Economics
-Statistics
-Finance
I deliver quality content with zero plagiarism in a timely manner. I have two years experience in the field of academic writing and online technical tutoring.
Some of my technical skills include:
-Microsoft Excel : Statistical analysis & Business Analytics
- R programming : Statistical analysis
- Web Development : HTML 5, CSS3, Bootstrap 4, PHP, Python, and Django.
0 Reviews
10+ Question Solved
Related Book For 

Question Posted:
