

The histogram shows the heights of 300 randomly selected high school students. Which of the following is
Question:
The histogram shows the heights of 300 randomly selected high school students. Which of the following is the best description of the shape of the distribution of heights?
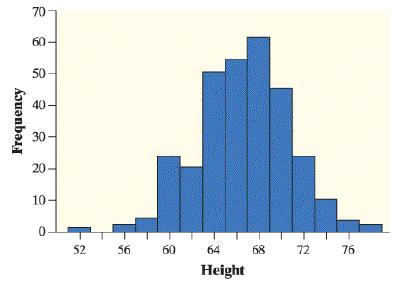
a. Roughly symmetric and single-peaked
b. Roughly symmetric and double-peaked
c. Roughly symmetric and multi-peaked
d. Skewed to the left
e. Skewed to the right
Select the best answer.
Fantastic news! We've Found the answer you've been seeking!
Step by Step Answer:
As the given distribution is unimode ...View the full answer

Answered By
Aqeela Parkar
I have completed bachelor of science in mathematics. I have done bachelor of education in mathematics from reputed University. I have 4 years full time teaching experience with 6 years tutoring experience. I am currently working as a subject matter expert in Chegg. I teach students with great interest and pleasure. Teaching and tutoring is my all time favorite hobby. I like to enhance children's skills by encouraging them properly.
0 Reviews
10+ Question Solved
Related Book For 

Question Posted:
