

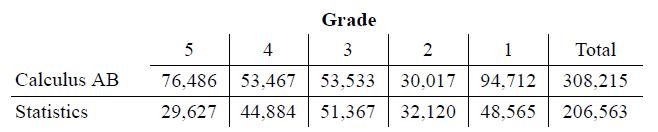
The table gives the distribution of grades earned by students taking the AP Calculus AB and AP
Question:
The table gives the distribution of grades earned by students taking the AP® Calculus AB and AP® Statistics exams in 2016.
a. Make an appropriate graphical display to compare the grade distributions for AP® Calculus AB and AP® Statistics.
b. Write a few sentences comparing the two distributions of exam grades.
Fantastic news! We've Found the answer you've been seeking!
Step by Step Answer:
ANSWER a Part a a 2nd step concept A typical graphing tool is the histogram I...View the full answer

Answered By
Aketch Cindy Sunday
I am a certified tutor with over two years of experience tutoring . I have a passion for helping students learn and grow, and I firmly believe that every student has the potential to be successful. I have a wide range of experience working with students of all ages and abilities, and I am confident that I can help students succeed in school.
I have experience working with students who have a wide range of abilities. I have also worked with gifted and talented students, and I am familiar with a variety of enrichment and acceleration strategies.
I am a patient and supportive tutor who is dedicated to helping my students reach their full potential. Thank you for your time and consideration.
0 Reviews
10+ Question Solved
Related Book For 

Question Posted:
