

To see if the claim made in Exercise 12 is true at their high school, an AP
Question:
To see if the claim made in Exercise 12 is true at their high school, an AP® Statistics class chooses an SRS of twenty 16- year-old females at the school and measures their heights. In their sample, the mean height is 64.7 inches. Does this provide convincing evidence that 16-year-old females at this school are taller than 64 inches, on average?
a. What is the evidence that the average height of all 16-year-old females at this school is greater than 64 inches, on average?
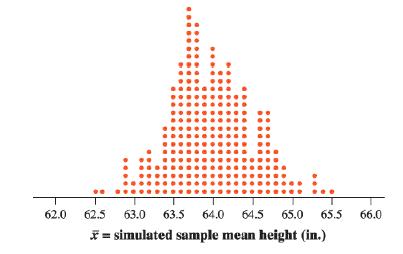
b. Provide two explanations for the evidence described in part (a). We used technology to simulate choosing 250 SRSs of size n = 20 from a population of three hundred 16-year-old females whose heights follow a Normal distribution with mean μ = 64 inches and standard deviation μ=2.5 inches. The dotplot shows x̅ = the sample mean height for each of the 250 simulated samples.
c. There is one dot on the graph at 62.5. Explain what this value represents.
d. Would it be surprising to get a sample mean of x̅ = 64.7 or larger in an SRS of size 20 when μ = 64 inches and σ = 2.5 inches? Justify your answer.
e. Based on your previous answers, is there convincing evidence that the average height of all 16-year-old females at this school is greater than 64 inches? Explain your reasoning.
Exercise 12.
According to the National Center for Health Statistics, the distribution of height for 16-year-old females is modeled well by a Normal density curve with mean μ = 64 inches and standard deviation σ = 2.5 inches. Assume this claim is true for the three hundred 16-year-old females at a large high school.
Step by Step Answer:
a One of the 250 samples that randomly selected 20 girls from the 300 16yearold females at t...View the full answer


