

According to Figure 2, which of the following graphs best represents the elevations, in meters above sea
Question:
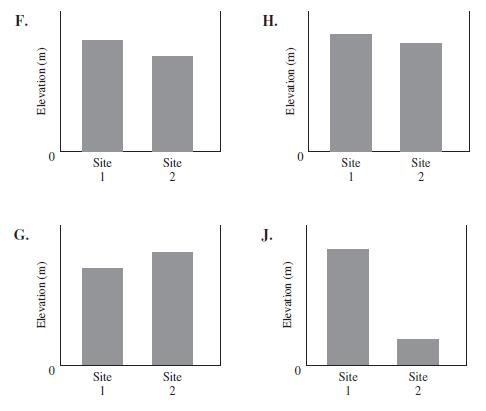
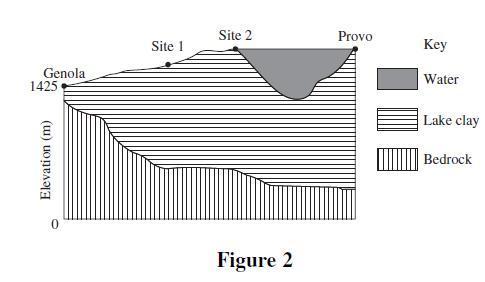
According to Figure 2, which of the following graphs best represents the elevations, in meters above sea level, of the top of the lake clay layer at Test Sites 1 and 2?
Fantastic news! We've Found the answer you've been seeking!
Step by Step Answer:
The correct answer is G According to Figure 2 both Site 1 and S...View the full answer

Answered By
HARSH RANJAN
Taken classes at college to graduates, Also worked as an expert to a freelancer online question-solving portal for more than 8 months with an average rating greater than 4.2 out of 5.
1+ Reviews
10+ Question Solved
Related Book For 

Question Posted:
