

Question 10 refers to the following data. For how many of the years shown in the graph
Question:
Question 10 refers to the following data.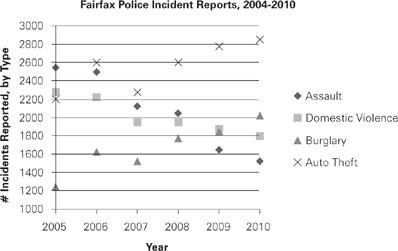
For how many of the years shown in the graph was the number of nonviolent crimes (burglary and auto theft) greater than the number of violent crimes (assault and domestic violence)?
- None
- One
- Two
- Three
- Four
Fantastic news! We've Found the answer you've been seeking!
Step by Step Answer:
D Before you add the number of violent and nonviolent crimes ...View the full answer

Answered By
Isaiah Mutinda
As a graduate with Bs in Maths and Computer Science and having worked as a freelance full stack software developer for 3 years running I believe I have what it takes to conformable tutor and mentor a student to a professional developer also.
2+ Reviews
10+ Question Solved
Related Book For 

1014 Practice Questions For The New GRE
ISBN: 9780375429682
2nd Edition
Authors: The Princeton Review
Question Posted:
