

Question 12 refers to the following data. For what year depicted in the graphs was the percent
Question:
Question 12 refers to the following data.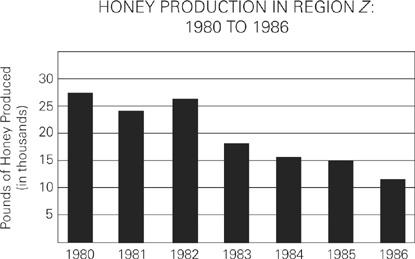
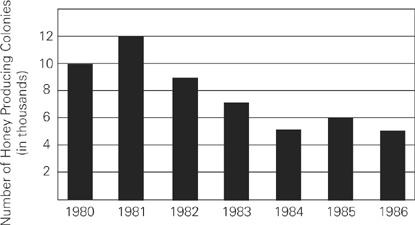
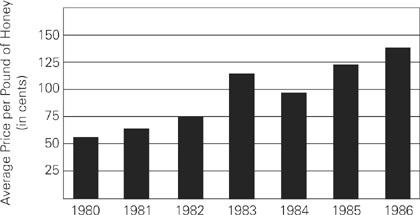
For what year depicted in the graphs was the percent decrease from the previous year of the number of honey producing colonies most similar to the average percent increase of the average price of a pound of honey for the six-year period?![]()
Fantastic news! We've Found the answer you've been seeking!
Step by Step Answer:
The question asks you to determine the overall average percent increase in the price per po...View the full answer

Answered By
Navdeep Sharma
I am graduated in Electronics and Communication Engineering from Punjab Technical University in 2013. I have been teaching physics since 2015. I am passionate about teaching. I usually connect things with real life examples as we know physics is the study of nature and it has very wide area to explore new things, phenomena etc. My students enjoy my lectures because i always try to balance the ratio theory as well as practical knowledge. Being an engineering graduate i am quite good at applied science and mathematics.
0 Reviews
10+ Question Solved
Related Book For 
1014 Practice Questions For The New GRE
ISBN: 9780375429682
2nd Edition
Authors: The Princeton Review
Question Posted:
