Which one of the following graphs best represents the relationship between the mineral volume and the age
Question:
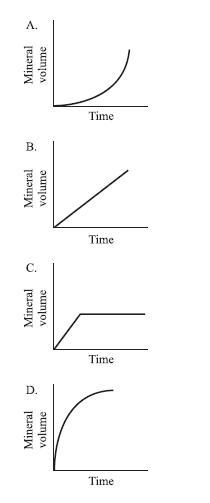
Which one of the following graphs best represents the relationship between the mineral volume and the age of the salt pans, according to Study 1?
Salt pans are unusual geologic formations found in deserts. They are formed in endorheic basins, which are lowland areas where water collects but has no outflow. Any rain that falls or any water that is collected in an endorheic basin remains there permanently, except for what is lost through evaporation. This type of closed system often leads to a high concentration of salt and other minerals.
Study 1
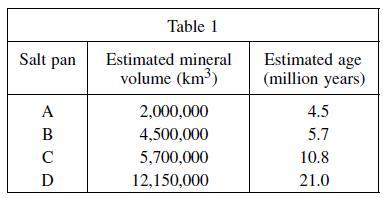
Four different salt pans around the world were studied. The volumes of mineral deposits were estimated from the surface areas of the salt pans and the average thickness of the deposits. The ages of the salt pans were also estimated based on the mineral volume. The estimates are shown in Table 1.
Step by Step Answer:
The best answer is B As Table 1 shows for Study 1 there is ...View the full answer