

Graph the function y = 2cos2x for -2 x 3.5. Then, on the same screen,
Question:
Graph the function y = 2cos2x for -2 ≤ x ≤ 3.5. Then, on the same screen, graph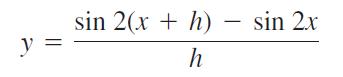
for h = 1.0, 0.5, and 0.2. Experiment with other values of h, including negative values. What do you see happening as h → 0? Explain this behavior.
Fantastic news! We've Found the answer you've been seeking!
Step by Step Answer:
To graph the function y 2cos2x for 2 x 35 we can use a graphing calculator or software The graph of ...View the full answer

Answered By
Darwin Romero
I use a hands-on technique and am approachable to my students. I incorporate fun into my lessons when possible. And while my easy-going style is suitable for many subjects and grades, I am also able to adapt my style to the needs of the student. I can describe myself as friendly, enthusiastic and respectful. As a teacher, we can easily get respect from the students if they would feel respected first
0 Reviews
10+ Question Solved
Related Book For 
Thomas Calculus Early Transcendentals
ISBN: 9780321884077
13th Edition
Authors: Joel R Hass, Christopher E Heil, Maurice D Weir
Question Posted:
