

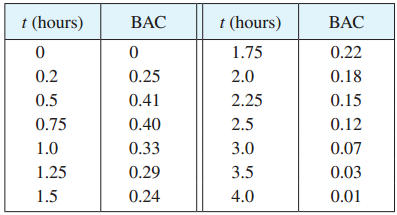
Researchers measured the blood alcohol concentration (BAC) of eight adult male subjects after rapid consumption of 30
Question:
(a) Use the readings to sketch the graph of the BAC as a function of t.
(b) Use your graph to describe how the effect of alcohol varies with time.
Fantastic news! We've Found the answer you've been seeking!
Step by Step Answer:
a b The blood alcohol concentration r...View the full answer

Answered By
David Ngaruiya
i am a smart worker who concentrates on the content according to my clients' specifications and requirements.
7+ Reviews
19+ Question Solved
Related Book For 

Question Posted:
