

Several research papers use a sinusoidal graph to model blood pressure. Assuming that a persons heart beats
Question:
Several research papers use a sinusoidal graph to model blood pressure. Assuming that a person’s heart beats 70 times per minute, the blood pressure P of an individual after t seconds can be modeled by the function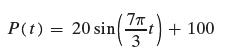
(a) In the interval [0, 1], determine the times at which the blood pressure is 100 mm Hg.
(b) In the interval [0, 1], determine the times at which the blood pressure is 120 mm Hg.
(c) In the interval [0, 1], determine the times at which the blood pressure is between 100 and 105 mm Hg.
Fantastic news! We've Found the answer you've been seeking!
Step by Step Answer:
To find the times at which the blood pressure is a specific value within the given interval we can s...View the full answer

Answered By
Surendar Kumaradevan
I have worked with both teachers and students to offer specialized help with everything from grammar and vocabulary to challenging problem-solving in a range of academic disciplines. For each student's specific needs, I can offer explanations, examples, and practice tasks that will help them better understand complex ideas and develop their skills.
I employ a range of techniques and resources in my engaged, interesting tutoring sessions to keep students motivated and on task. I have the tools necessary to offer students the support and direction they require in order to achieve, whether they need assistance with their homework, test preparation, or simply want to hone their skills in a particular subject area.
0 Reviews
10+ Question Solved
Related Book For 
Precalculus Concepts Through Functions A Unit Circle Approach To Trigonometry
ISBN: 9780137945139
5th Edition
Authors: Michael Sullivan
Question Posted:
