

The data in the table on the right represent the median sales price of houses sold in
Question:
The data in the table on the right represent the median sales price of houses sold in the United States in the fourth quarter (October to December) of the year shown.(a) With a graphing utility, draw a scatter plot of the data. Comment on the type of relation that appears to exist between the two variables.(b) Decide on the function of best fit to these data (linear, quadratic, or cubic), and use this function to predict the median new-home price in the United States for the fourth quarter of 2023 (t = 10).(c) Draw the function of best fit on the scatter plot obtained in part (a).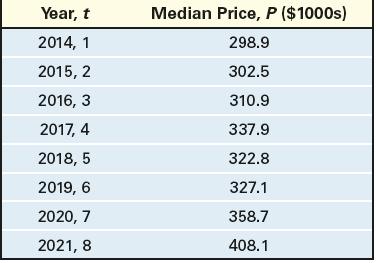
Step by Step Answer:

This question has not been answered yet.
You can Ask your question!
Related Book For 

Precalculus Concepts Through Functions A Unit Circle Approach To Trigonometry
ISBN: 9780137945139
5th Edition
Authors: Michael Sullivan
Question Posted:
