

The figure on the left shows the graph of a function. The figure on the right shows
Question:
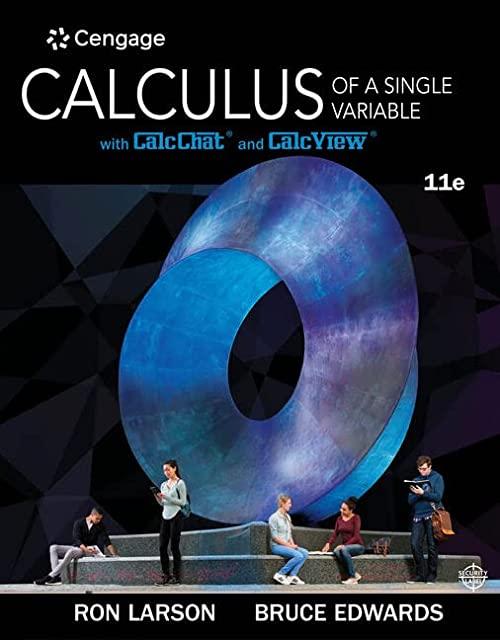
The figure on the left shows the graph of a function. The figure on the right shows the graph of a power series representation of the function.
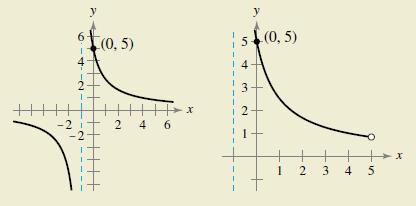
(a) Identify the function.(b) What are the center and interval of convergence of the power series?
Fantastic news! We've Found the answer you've been seeking!
Step by Step Answer:

Answered By
Madhvendra Pandey
Hi! I am Madhvendra, and I am your new friend ready to help you in the field of business, accounting, and finance. I am a College graduate in B.Com, and currently pursuing a Chartered Accountancy course (i.e equivalent to CPA in the USA). I have around 3 years of experience in the field of Financial Accounts, finance and, business studies, thereby looking forward to sharing those experiences in such a way that finds suitable solutions to your query.
Thus, please feel free to contact me regarding the same.
1+ Reviews
10+ Question Solved
Related Book For 
Calculus Of A Single Variable
ISBN: 9781337275361
11th Edition
Authors: Ron Larson, Bruce H. Edwards
Question Posted:
