

The following data represent the percent of all drivers by age that have been stopped by the
Question:
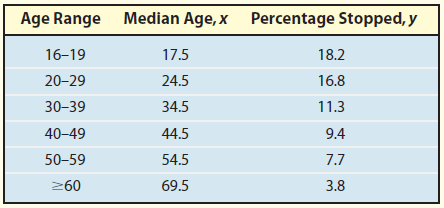
(a) Using your graphing utility, draw a scatter diagram of the data treating median age, x, as the independent variable.
(b) Determine a model that you feel best describes the relation between median age and percentage stopped. You may choose from among linear, quadratic, cubic, exponential, logarithmic, or logistic models.
Fantastic news! We've Found the answer you've been seeking!
Step by Step Answer:
a b Loga...View the full answer

Answered By
Charles mwangi
I am a postgraduate in chemistry (Industrial chemistry with management),with writing experience for more than 3 years.I have specialized in content development,questions,term papers and assignments.Majoring in chemistry,information science,management,human resource management,accounting,business law,marketing,psychology,excl expert ,education and engineering.I have tutored in other different platforms where my DNA includes three key aspects i.e,quality papers,timely and free from any academic malpractices.I frequently engage clients in each and every step to ensure quality service delivery.This is to ensure sustainability of the tutoring aspects as well as the credibility of the platform.
2+ Reviews
10+ Question Solved
Related Book For 

Question Posted:
