

The following data represent the price p and quantity demanded per day q of 24-in. OLED monitors.
Question:
The following data represent the price p and quantity demanded per day q of 24-in. OLED monitors.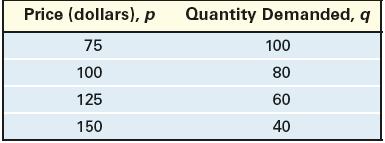
(a) Plot the ordered pairs (p, q) in a Cartesian plane.
(b) Show that quantity demanded q is a linear function of price p.
(c) Determine the linear function that describes the relation between p and q.
(d) What is the implied domain of the linear function?
(e) Graph the linear function in the Cartesian plane drawn in part (a).
(f) Interpret the slope.
(g) Interpret the values of the intercepts.
Step by Step Answer:

This question has not been answered yet.
You can Ask your question!
Related Book For 

Precalculus Concepts Through Functions A Unit Circle Approach To Trigonometry
ISBN: 9780137945139
5th Edition
Authors: Michael Sullivan
Question Posted:
