

The graph below shows the height h, in meters, of a discus t seconds after it is
Question:
The graph below shows the height h, in meters, of a discus t seconds after it is thrown.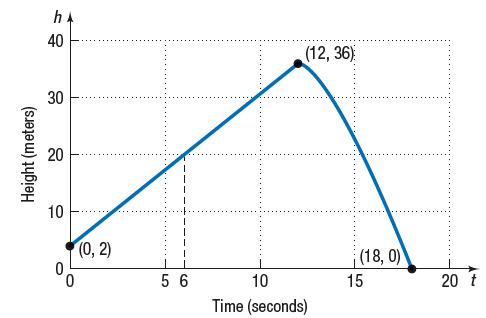
(a) What is the height of the discus after 6 seconds?
(b) When does the discus reach its maximum height? What is the maximum height?
(c) Identify and interpret the intercepts.
Fantastic news! We've Found the answer you've been seeking!
Step by Step Answer:
This question simply checks how well you can interpret a graph The x axis represents the timesecon...View the full answer

Answered By
Indira sai Bollepalli
Well I have graduated with high grades in both my O and A levels including A* in mathematics in both which is the reason I have opted to tutor in mathematics coupled with the fact that I just love mathematics. Although in terms of actual tutoring experience as a job, I have none but throughout my high school years, I have helped out my friends in solving questions and understanding difficult topics. Therefore am looking forward to helping you guys out too :)
0 Reviews
10+ Question Solved
Related Book For 
Precalculus Concepts Through Functions A Unit Circle Approach To Trigonometry
ISBN: 9780137945139
5th Edition
Authors: Michael Sullivan
Question Posted:
