

The graph in the accompanying figure shows the average Fahrenheit temperature in Fairbanks, Alaska, during a typical
Question:
The graph in the accompanying figure shows the average Fahrenheit temperature in Fairbanks, Alaska, during a typical 365-day year. The equation that approximates the temperature on day x is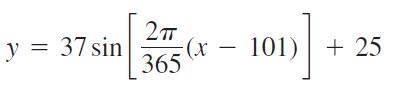
and is graphed in the accompanying figure.
a. On what day is the temperature increasing the fastest?
b. About how many degrees per day is the temperature increasing when it is increasing at its fastest?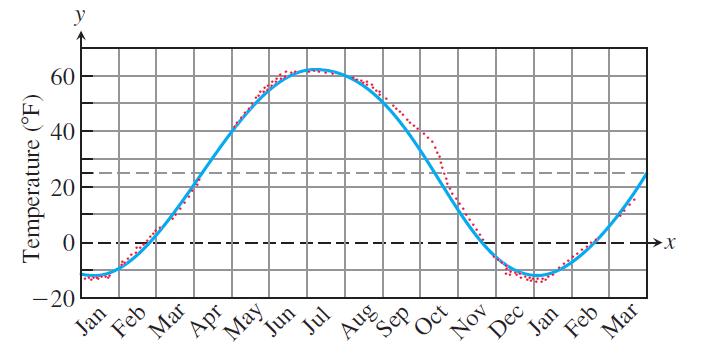
Step by Step Answer:

This question has not been answered yet.
You can Ask your question!
Related Book For 
Thomas Calculus Early Transcendentals
ISBN: 9780321884077
13th Edition
Authors: Joel R Hass, Christopher E Heil, Maurice D Weir
Question Posted:
