

The graphs in the accompanying figure show the position s, velocity y = ds/dt, and acceleration a
Question:
The graphs in the accompanying figure show the position s, velocity y = ds/dt, and acceleration a = d2s/dt2 of a body moving along a coordinate line as functions of time t. Which graph is which? Give reasons for your answers.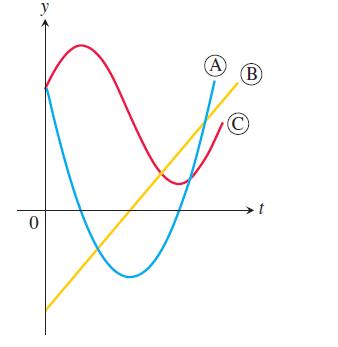
Fantastic news! We've Found the answer you've been seeking!
Step by Step Answer:
From the graphs provided in the figure we can identify the position velocity and acceleration of a b...View the full answer

Answered By
Churchil Mino
I have been a tutor for 2 years and have experience working with students of all ages and abilities. I am comfortable working with students one-on-one or in small groups, and am able to adapt my teaching style to meet the needs of each individual. I am patient and supportive, and my goal is to help my students succeed.
I have a strong background in math and science, and have tutored students in these subjects at all levels, from elementary school to college. I have also helped students prepare for standardized tests such as the SAT and ACT. In addition to academic tutoring, I have also worked as a swim coach and a camp counselor, and have experience working with children with special needs.
0 Reviews
10+ Question Solved
Related Book For 
Thomas Calculus Early Transcendentals
ISBN: 9780321884077
13th Edition
Authors: Joel R Hass, Christopher E Heil, Maurice D Weir
Question Posted:
