

The manager of a store recorded the annual sales S (in thousands of dollars) of a product
Question:
The manager of a store recorded the annual sales S (in thousands of dollars) of a product over a period of 7 years, as shown in the table, where t is the time in years, with t = 8 corresponding to 2008.
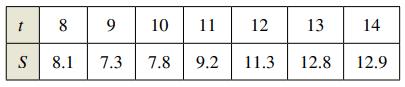
(a) Use the regression capabilities of a graphing utility to find a model of the form S = at3 + bt2 + ct + d for the data.
(b) Use a graphing utility to plot the data and graph the model.
(c) Use calculus and the model to find the time t when sales were increasing at the greatest rate.
(d) Do you think the model would be accurate for predicting future sales? Explain.
Fantastic news! We've Found the answer you've been seeking!
Step by Step Answer:
a To find a model of the form Sat 3 bt 2 ctd for the data we can use regression analysis Using a gra...View the full answer

Answered By
Aqib Parvej
I am teaching since my graduation time so I have teaching experience of about 5 years and in these years I learn to teach in the best and interesting way .
20+ Reviews
41+ Question Solved
Related Book For 

Calculus Of A Single Variable
ISBN: 9781337275361
11th Edition
Authors: Ron Larson, Bruce H. Edwards
Question Posted:
