

The table shows the temperatures T (in degrees Fahrenheit) at which water boils at selected pressures p
Question:
The table shows the temperatures T (in degrees Fahrenheit) at which water boils at selected pressures p (in pounds per square inch).
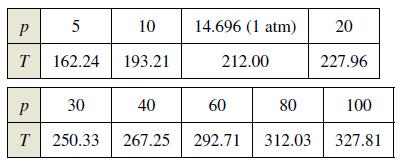
A model that approximates the data is T = 87.97 + 34.96 ln p + 7.91√p.
(a) Use a graphing utility to plot the data and graph the model.(b) Find the rates of change of T with respect to p when p = 10 and p = 70.(c) Use a graphing utility to graph T'. Find lim p∞ T'(p) and interpret the result in the context of the problem.
Fantastic news! We've Found the answer you've been seeking!
Step by Step Answer:
a b T10 475...View the full answer

Answered By
Fahmin Arakkal
Tutoring and Contributing expert question and answers to teachers and students.
Primarily oversees the Heat and Mass Transfer contents presented on websites and blogs.
Responsible for Creating, Editing, Updating all contents related Chemical Engineering in
latex language
8+ Reviews
22+ Question Solved
Related Book For 

Calculus Of A Single Variable
ISBN: 9781337275361
11th Edition
Authors: Ron Larson, Bruce H. Edwards
Question Posted:
