

The table shows the yield y (in milligrams) of a chemical reaction after t minutes. (a) Use
Question:
The table shows the yield y (in milligrams) of a chemical reaction after t minutes.
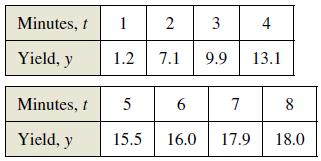
(a) Use the regression capabilities of a graphing utility to find the least squares regression line for the data. Then use the graphing utility to plot the data and graph the model.
(b) Use a graphing utility to plot the points (ln t, y). Do these points appear to follow a linear pattern more closely than the plot of the given data in part (a)?
(c) Use the regression capabilities of a graphing utility to find the least squares regression line for the points (ln t, y) and obtain the logarithmic model y = a + b ln t.
(d) Use a graphing utility to plot the original data and graph the linear and logarithmic models. Which is a better model? Explain.
Step by Step Answer:

This question has not been answered yet.
You can Ask your question!


Calculus Of A Single Variable
ISBN: 9781337275361
11th Edition
Authors: Ron Larson, Bruce H. Edwards
