

Three runners compete in a 100-meter race. The graph depicts the distance run as a function of
Question:
Three runners compete in a 100-meter race. The graph depicts the distance run as a function of time for each runner. Describe in words what the graph tells you about this race. Who won the race? Did each runner finish the race? 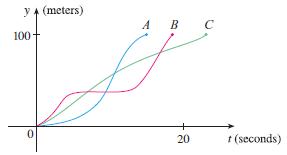
Fantastic news! We've Found the answer you've been seeking!
Step by Step Answer:
Runner A won the race reaching the finish line at 100 meters in about 15 seconds follo...View the full answer

Answered By
Nazrin Ziad
I am a post graduate in Zoology with specialization in Entomology.I also have a Bachelor degree in Education.I posess more than 10 years of teaching as well as tutoring experience.I have done a project on histopathological analysis on alcohol treated liver of Albino Mice.
I can deal with every field under Biology from basic to advanced level.I can also guide you for your project works related to biological subjects other than tutoring.You can also seek my help for cracking competitive exams with biology as one of the subjects.
2+ Reviews
10+ Question Solved
Related Book For 

Question Posted:
