

Use the graph of f shown in the figure to answer the following. (a) Approximate the slope
Question:
Use the graph of f′ shown in the figure to answer the following.
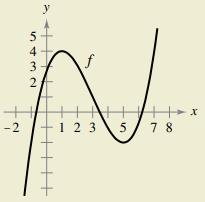
(a) Approximate the slope of f at x = 4. Explain.
(b) Is f(5) − f(4) > 0? Explain.
(c) Approximate the value of x where f is maximum. Explain.
(d) Approximate any open intervals on which the graph of f is concave upward and any open intervals on which it is concave downward. Approximate the x-coordinates of any points of inflection.
Fantastic news! We've Found the answer you've been seeking!
Step by Step Answer:
The graph provided appears to be the graph of the derivative of a function fx rather than the graph of the function fx itself based on the notation in ...View the full answer

Answered By
Muhammad Ahtsham Shabbir
I am a professional freelance writer with more than 7 years’ experience in academic writing. I have a Bachelor`s Degree in Commerce and Master's Degree in Computer Science. I can provide my services in various subjects.
I have professional excellent skills in Microsoft ® Office packages such as Microsoft ® Word, Microsoft ® Excel, and Microsoft ® PowerPoint. Moreover, I have excellent research skills and outstanding analytical and critical thinking skills; a combination that I apply in every paper I handle.
I am conversant with the various citation styles, among them; APA, MLA, Chicago, Havard, and AMA. I also strive to deliver the best to my clients and in a timely manner.My work is always 100% original. I honestly understand the concern of plagiarism and its consequences. As such, I ensure that I check the assignment for any plagiarism before submission.
392+ Reviews
587+ Question Solved
Related Book For 
Calculus Of A Single Variable
ISBN: 9781337275361
11th Edition
Authors: Ron Larson, Bruce H. Edwards
Question Posted:
