

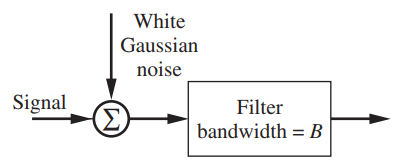
Consider again the band pass channel illustrated in Figure 12.46. The noise power spectral density is 10-5
Question:
Figure 12.46
Fantastic news! We've Found the answer you've been seeking!
Step by Step Answer:
We now determine The plot is given in Figure 126 For su...View the full answer

Answered By
Muhammad Ghyas Asif
It is my obligation to present efficient services to my clients by providing a work of quality, unique, competent and relevant. I hope you have confidence in me and assign me the order and i promise to follow all the instructions and keep time.
109+ Reviews
203+ Question Solved
Related Book For 
Principles of Communications Systems, Modulation and Noise
ISBN: 978-8126556793
7th edition
Authors: Rodger E. Ziemer, William H. Tranter
Question Posted:
