

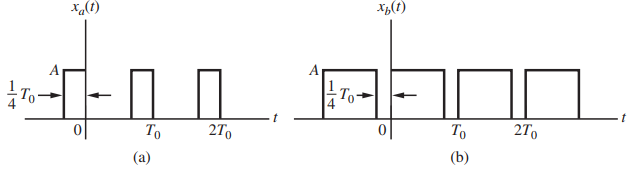
Using the results given in Table 2.1 for the Fourier coefficients of a pulse train, plot the
Question:
(Note that xb(t) = -xa(t) + A.
How is a sign change and DC level shift manifested in the spectrum of the waveform?)
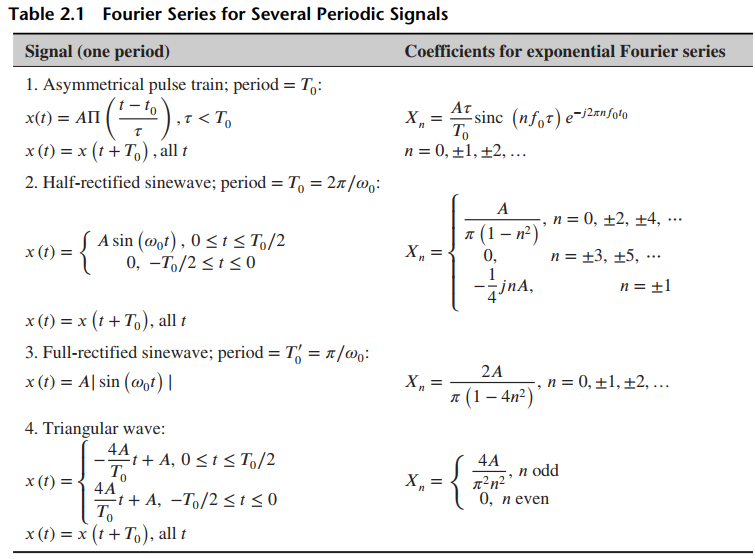
Figure 2.34
Fantastic news! We've Found the answer you've been seeking!
Step by Step Answer:
a In the expression for the Fourier series of a pulse trai...View the full answer

Answered By
John Aketch
I have a 10 years tutoring experience and I have helped thousands of students to accomplish their educational endeavors globally. What interests me most is when I see my students being succeeding in their classwork. I am confident that I will bring a great change to thins organization if granted the opportunity. Thanks
8+ Reviews
18+ Question Solved
Related Book For 

Principles of Communications Systems, Modulation and Noise
ISBN: 978-8126556793
7th edition
Authors: Rodger E. Ziemer, William H. Tranter
Question Posted:
